
Total Articles: 43
Today's Visitors: 40

Journal of the Bahrain Medical Society
Year 2014, Volume 25, Issue 1, Pages 24-28
https://doi.org/10.26715/jbms.p25_6Yasir M. Khaleel,* Baybeen K. Al-Selevany,* Muzahim F. Mahmood**
*Department of Medical Physiology, College of Medicine, University of Mosul, Mosul, Iraq
**Department of Medicine, College of Medicine, University of Mosul, Mosul, Iraq
Correspondence to: ymk6889@gmail.com

Background: In spite of the clinical importance of accurate measurement of QT and corrected QT intervals during electrocardiographic interpretation, there appears to be some considerable difficulty in its precise measurement and in the determining of the upper accepted value for each gender. In addition to gender, QT intervals can also be affected by age and racial factors.
Objectives: To evaluate the impact of age on corrected QT interval in healthy adults according to gender.
Methods: Electrocardiograms from 563 apparently healthy adults (386 male and 177 female) aged 18-40 years were obtained using Cardios PC based ECG machine; 12-lead ECGs were recorded and corrected QT interval was measured by computer and reviewed manually in leads II, V2, V3, V5 and V6. The correction of QT interval was based on Bazett’s formula. The mean QTc was calculated for the whole study sample and then for each gender separately; the mean QTc was compared between genders and in different age groups. Linear regression lines of QTc versus age were drawn in each gender separately.
Results: The mean ±SD of QTc (414.95 ±24.94) in the study sample was within normal range although close to upper limits. Subjects with prolonged QTc (>430 ms) represented about 24% of the total. The mean QTc in females was significantly longer than males (p=0.001), prolonged QTc was also significantly more frequent in females (p=0.001). There was a significant increase in the mean QTc with increasing age in the study sample (p=0.001), and a significant increase in the frequency of reported prolonged QTc with the older age group (p=0.018). Linear regression lines of QTc versus age in each gender separately have shown that females have longer QTc than males; the difference was more noticeable in younger females and decreased with increasing age.
Conclusions: QTc interval is both age and gender dependent, so it is worth using linear regression lines drawn according to age and gender in the determination of its normal value.
Keywords: corrected QT interval; healthy adults; age; gender
The QT interval represents both events of ventricular depolarization and repolarization; it is measured from the beginning of the QRS complex to the end of T wave. It varies inversely with the heart rate (HR). A rate-corrected QT interval (QTc) can be calculated as:
QTc = QT/√RR interval (in seconds) “Dr. Bazett’s formula”1, 2
• Normal QTc: 350-430 ms for heart rates of 60-100 bpm.
• Prolonged QTc: >430 ms; some references consider >440 ms.
• Short QTc: <350 ms for heart rates of 60-100 bpm.
The QT interval in ECG is of significant clinical importance, primarily because prolongation of this interval can predispose to a potentially fatal ventricular arrhythmia known as torsade de pointes. Prolonged QT interval may be inherited, i.e. Long QT Syndrome (LQTS), drug induced or due to electrolyte imbalance including hypokalemia and hypomagnesaemia3. Individuals with LQTS may or may not manifest QT prolongation on a resting ECG, rarely it may be triggered by exertion, swimming, emotion, auditory stimuli, or may occur in the postpartum period and lead to life-threatening torsade de pointes ventricular tachycardia4.
Short QT syndrome (SQTS) was first described in 2000 by Gussak et al.5 It is reported that the short QT interval (usually ≤320 ms) is associated with increased risk of paroxysmal atrial fibrillation, syncope and sudden cardiac death (SCD)4, 5, 6.
In spite of the clinical importance of accurately measuring the QT interval, its measurement can be quite challenging for several reasons, these include identifying the beginning of the QRS complex and end of the T wave, determining which lead(s) should be used, and adjusting of the measured interval for rate, QRS duration, and gender7. Because the onset of the QRS and the end of the T wave do not occur simultaneously in every lead, the QT interval duration will vary from lead to lead by as much as 50 to 65 ms4. When the interval is to be measured from a single lead, the lead in which the interval is the longest most commonly is lead V2or V34.
It has been recommended that QT measurement should be made in leads II and V5 or V6; and several successive beats should be measured with the longest value being used8. The main difficulty lies in correctly identifying the point where the descending limb of T wave intersects the isoelectric line, particularly when there are T and U waves that are close together8, 9, large U waves (>1 mm) that are fused to the T wave should be included in the QT interval measurement, while smaller U waves and those that are separate from T wave should be excluded8, 10.
In automated computerized electrocardiographic systems, the interval is typically measured from a composite of all leads, with the interval beginning with the earliest onset of the QRS in any lead and ending with the end of the final T wave in any lead4.
The duration of the QT interval varies widely in the general population, which can be as a result of the substantial variation in measurements between repeated recordings in the same person (explaining as much as one-third of the variation), as well as inter-individual variations in various biologic, pharmacologic, metabolic, and genetic factors11,12.
One of the most widely acknowledged formulas used to correct the measured QT for the heart rate is the Bazett formula. Large database studies have shown that the QTc interval based on the Bazett formula remains significantly affected by heart rate and that as many as 30% of normal ECGs would be diagnosed as having a prolonged QT interval when this formula is used13. The formula, in general, leads to over-correction of the QT interval at high heart rates and under-corrects at low rates. Nearly all computerized ECG systems use this formula for QT measurement correction for the heart rate.
A joint committee of the American Heart Association and the American College of Cardiology has recently recommended using a linear regression function7. Several linear models have been proposed; one formula that has been shown to be relatively insensitive to heart rate13 is Hodges formula:
QTc = QT+1.75 (HR - 60)
Where HR is the heart rate; the intervals are measured in milliseconds.
Additional factors affecting the variability in QT and QTc intervals were reported in a recent survey which indicated that many clinicians simply do not know how to measure the QT interval. Although 61% of the respondents were able to identify what the QT interval represented on an ECG, it was found that only 36% correctly measured it14.
A study by Bazett in 1920 was the first description of longer corrected QT interval in women. This study reported a mean difference of 24 ms between men and women15; subsequent studies using various methods of correcting the QT interval have confirmed this gender difference16, 17.
The aim of this study was to evaluate the impact of age on QTc interval in each gender.
The present study was conducted on 563 healthy individuals, 386 male and 177 female, aged 18-40 years, from 26th Feb. 2012 to 23rd Jan. 2013. Individuals included in the study were free from any cardiovascular abnormality or any other disease or condition affecting the cardiovascular system. Assessments were made by the researchers based on information obtained from participants during interview. Participants were recruited from the outpatient clinics in E.N.T, dermatology, allergy, ophthalmology, urinary, general surgery, and internal medicine in Ibn Sina and Al-Zahrawee general teaching hospitals in Mosul city. Consent to participate was obtained after a full explanation of the aims of the study. Each participant received a clinical examination to exclude any cardiovascular disease: blood pressure (systolic <140; diastolic <90 mm Hg); oral temperature (36.2-37.2 C°).
ECGs were done in supine position and subjects were allowed to have at least 20 minutes rest before doing ECG. These were conventional 12-lead electrocardiograms using a Cardios computerized ECG machine and HP Pavilion g series laptop computer. Careful cleansing of the skin by 70% alcohol was done at the sites of electrodes placement to clean the skin from sebaceous secretions, then electrolytic gel was applied. Great care was taken to avoid the presence of any conducting material in the vicinity of the electrocardiogram machine. The machine was calibrated as 1 mV equal to 10 mm amplitude, and the recording speed was 25 mm/second.
The QTc was measured by computer and reviewed manually in leads II, V2, V3, V5 and V6. QT interval was measured from the onset of QRS complex to the end of T wave, and the end of T wave was defined as the intersection of a tangent to the steepest slope of the last limb of the T wave and the baseline (Figure 1). The measured QT interval was then corrected for the heart rate by using Bazett’s formula.
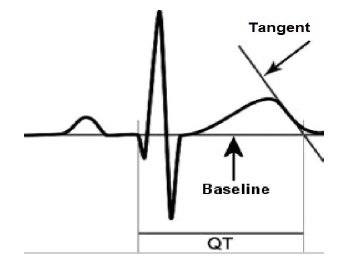
Figure 1. Measurement of QT interval; A tangent is drawn to the steepest slope of the last limb of the T wave; the end of the T wave is the intersection of this tangent with the baseline 18
Data analysis was performed using Minitab version 14.2 software statistical programs. Frequencies, percentage, mean and SD were calculated and used in describing ECG parameters. Independent T-test for two means, one-way ANOVA-test for more than two means, Z-test for two proportions and Chi-square test were used. P-value <0.05 was considered significant during data analysis.
The mean age (±SD) of the study sample was 28.70 ±7.34 years, of whom 386 (69%) were males and 177 (31%) were females. The mean QTc (±SD) with minimum and maximum value in the study sample are shown in Table 1. The percentage of subjects in the study sample with normal, short, and prolonged QTc interval is shown in Table 2.
Table 1. Mean and SD of QTc interval
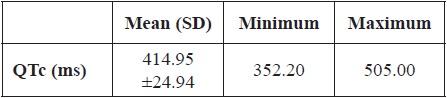
Table 2. The normal and abnormal findings of QTc interval
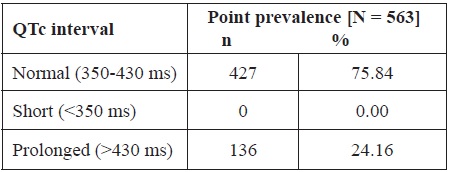
Table 3. Gender difference in the mean QTc interval
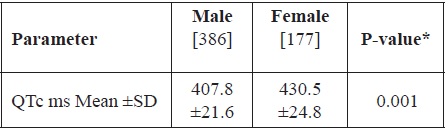
* Independent T-test of two means
Table 4. Gender difference in prolonged QTc interval
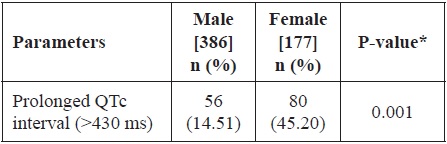
* Z-test for two proportions
Comparison of the mean QTc interval (±SD) between the two genders is shown in Table 3, females having longer QTc intervals than males (p=0.001). Comparison between the two genders in regards to the frequency of prolonged QTc interval in the study sample is shown in Table 4; prolonged QTc was found to be more frequent in females (p=0.001).
The study sample was divided into five age groups and the QTc mean (±SD) was compared in these age groups. There was a highly significant increase in the mean QTc with increased age of the group (p=0.001) (Table 5). There was a significant increase in the frequency of prolonged QTc interval with increased age of the group (p=0.018) (Table 6).
Table 5. Comparison between mean QTc interval and age groups
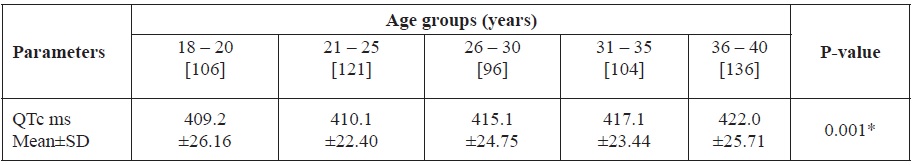
*One-way ANOVA-test for more than two means
Table 6. Age groups differences in prolonged QTc interval
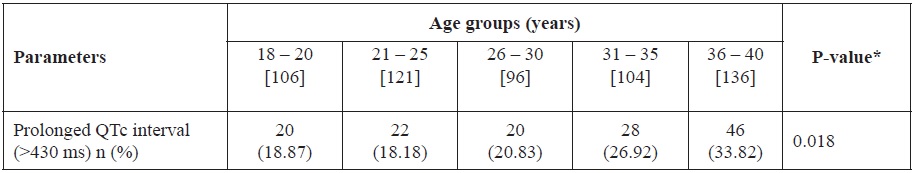
* Chi-square test d.f = 4.
The impact of age on QTc interval in each gender separately in the study sample was evaluated by drawing linear regression lines of QTc versus age in each gender separately (Figure 2).
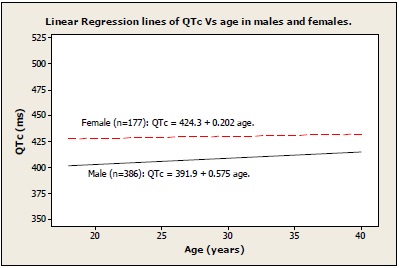 Figure 2. The impact of age on QTc in each gender
The mean QTc interval in the study sample was within normal range. There were no reported cases of short QTc in this study, while there were 136 cases having prolonged QTc in the study sample (about 24%). Further evaluation of this relatively high percentage of prolonged QTc was done by calculating the mean (±SD) QTc for each gender and comparing them; females were found to have a significantly longer mean QTc than males (p=0.001). This finding of gender differences is in agreement with several studies using various methods of correcting the QT interval16, 17. The number of female participants having prolonged QTc (>430 ms) was significantly greater than male participants (p=0.001). The most likely explanation would be the possibility of sex hormones having a direct and/or indirect effect on cardiac depolarization and repolarization, since the difference is not observed before puberty19, 20. Estrogens facilitate bradycardia-induced prolongation of the QT interval and the emergence of arrhythmias, whereas androgens shorten the QT interval and blunt the QT response to drugs. The male-corrected QT interval shortens at puberty and remains short until about 50 years of age; a period coinciding with the highest androgen levels. In an attempt to determine if the QT shortening was secondary to a lack of estrogen or a preponderance of testosterone, Bidoggia et al.21 studied a group of castrated men and virilised women. The electrocardiographic patterns of repolarization in the castrated men were slower and longer than that of normal men. Women with virilization exhibited faster and shorter repolarization than normal women and castrated men. The abnormal repolarization observed in castrated men normalized with the administration of testosterone, implying that testosterone plays an important role in modulating cardiac repolarization. Burke et al.22, showed that the differences in autonomic tone and menstrual cycle variability in the corrected QT in women at rest do not appear to be responsible for the gender differences in the QT interval. The gender differences in the corrected QT interval may be, to some extent, dependent on the correction formula used. A linear correction formula provides less of a gender difference than does the Bazett formula23.
To evaluate the effect of age on QTc in the study sample, the study sample was divided into five age groups and then QTc mean (±SD) has been compared in these age groups. There was highly significant increase in the mean QTc with increased age of the group (p=0.001). Also, when the reported prolonged QTc were compared between the five age groups a significant increase in the frequency of prolonged QTc interval was found with increased age of the group (p=0.018).
The results of this study were in agreement with a number of studies which have demonstrated that QT interval is longer in young and middle-aged females than in males. The gender difference is potentially important because women are generally considered to be more prone than men. The results of this study were in agreement with a number of studies which have demonstrated that QT interval is longer in young and middle-aged females than in males. The gender difference is potentially important because women are generally considered to be more prone than men
The gender difference in rate-adjusted QT interval decreases after 40 years of age and practically disappears in older men and women. For that reason separate gender- and age-specific QT-adjustment formulas have been proposed to accommodate these differences24-26.
In order to have a clearer picture about the impact of age in each gender, linear regression lines of QTc versus age were drawn separately for each gender. According to these regression lines females have longer QTc throughout the age range of the study sample, but the gap shortens with increased age, with the biggest gap occurring at younger ages. Both genders have shown lengthening of QTc interval with age, but in males the lengthening was clearer than in females.
In conclusion, because QTc interval is both age and gender dependent the use of linear regression lines for determination of normal QTc interval can prove to be beneficial.